SMARTGIS · GEOPUT · BELGRADE 2026MISSION 307-1

THE STREET, MEASURED ONCE, READ BY MACHINE.

A street inventory derived from mobile-mapping LiDAR and street panoramas, checked line by line against the city's own register.
Every figure in this deck is a door — click it and the scene opens, live, at that camera.
Or drive the whole mission — 12 stops along the vehicle's own route, one key between them
01  /  THE REGISTER82 SURVEYED LAYERS

The city already knows what is on its streets. It knows because people walked it.

Belgrade's register holds 82 surveyed layers — every kerb, every painted line, every sign, every manhole, with a code and a date. It is the most valuable thing in this project, and it is also the reason the work is slow: it was measured on foot and it goes out of date the moment a street is rebuilt.

307,649
kerb features, T05
145,186
pavement edges, T06
83,360
longitudinal markings, T22
71,550
traffic signs, T19
72,730
manholes, T66
COUNTED FROM Katastar-FazeI-VI.gdb · the production geodatabase, all phases
02  /  ONE PASS307-1 · 755 M POINTS

One drive-past, and the geometry falls out.

A vehicle with a laser scanner and a panoramic camera drives the street once. From that single pass we derive the kerb, the road markings and the pavement edges as GIS-ready polylines, and score every metre of them against the register.

line layersurveyedF1 @ 30 cm
kerb · T0519.4 km0.888
markings · T22–T267.4 km0.877
pavement edges · T06, T1443.5 km0.822
one mission70.3 km—

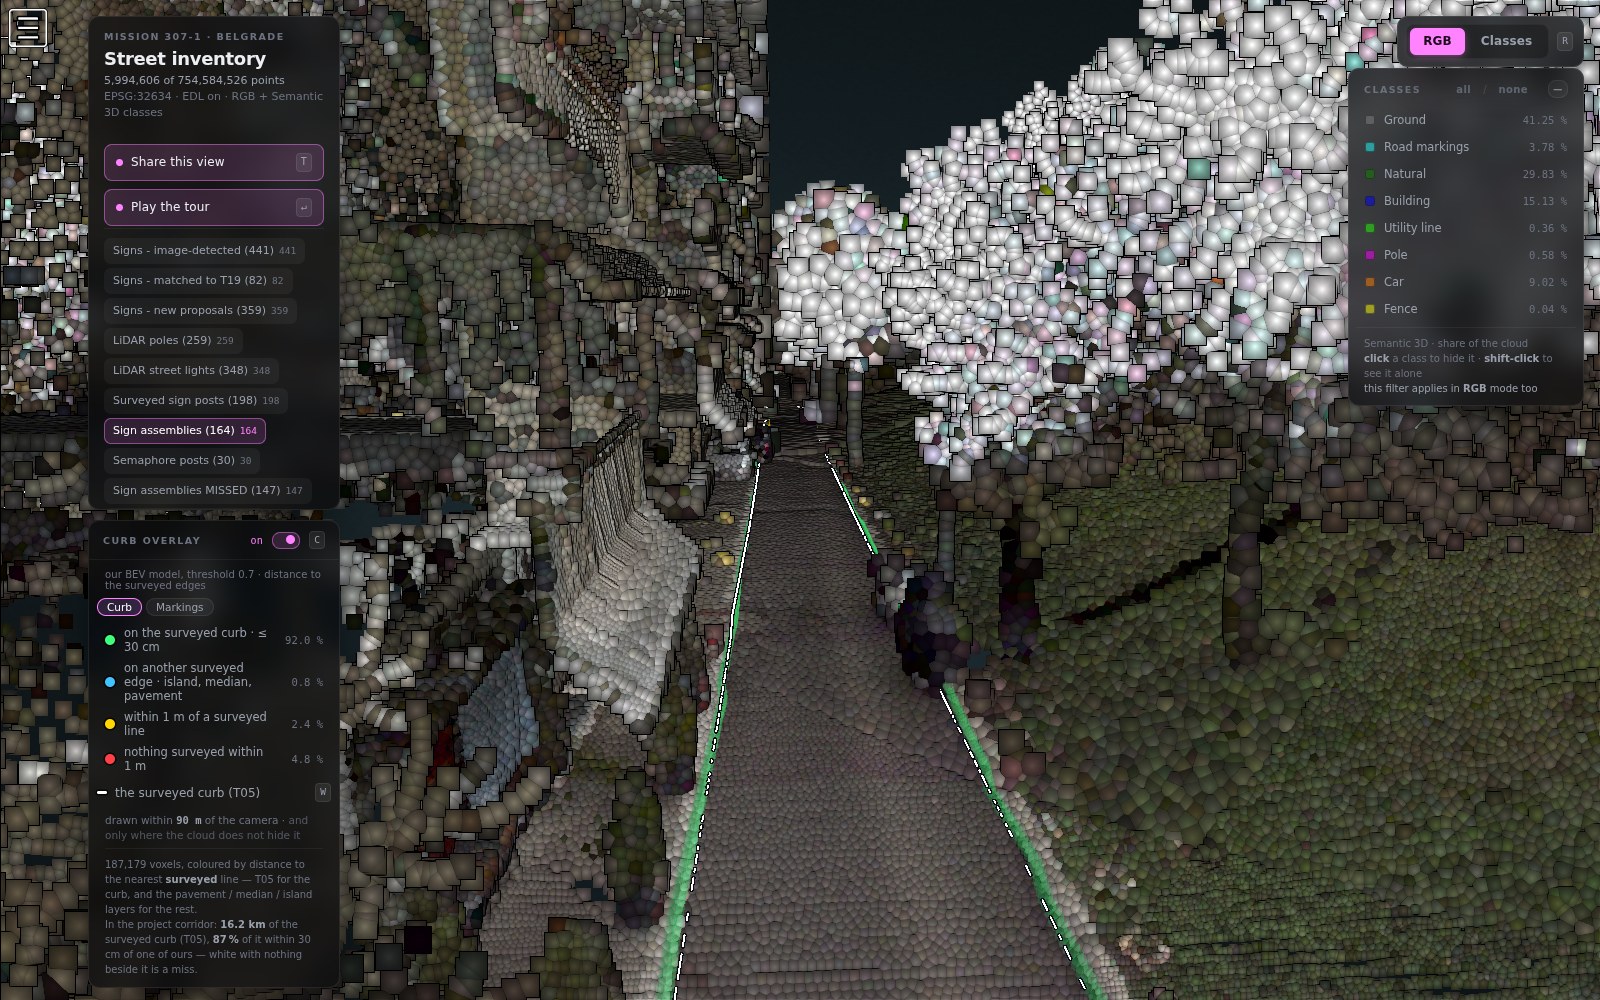
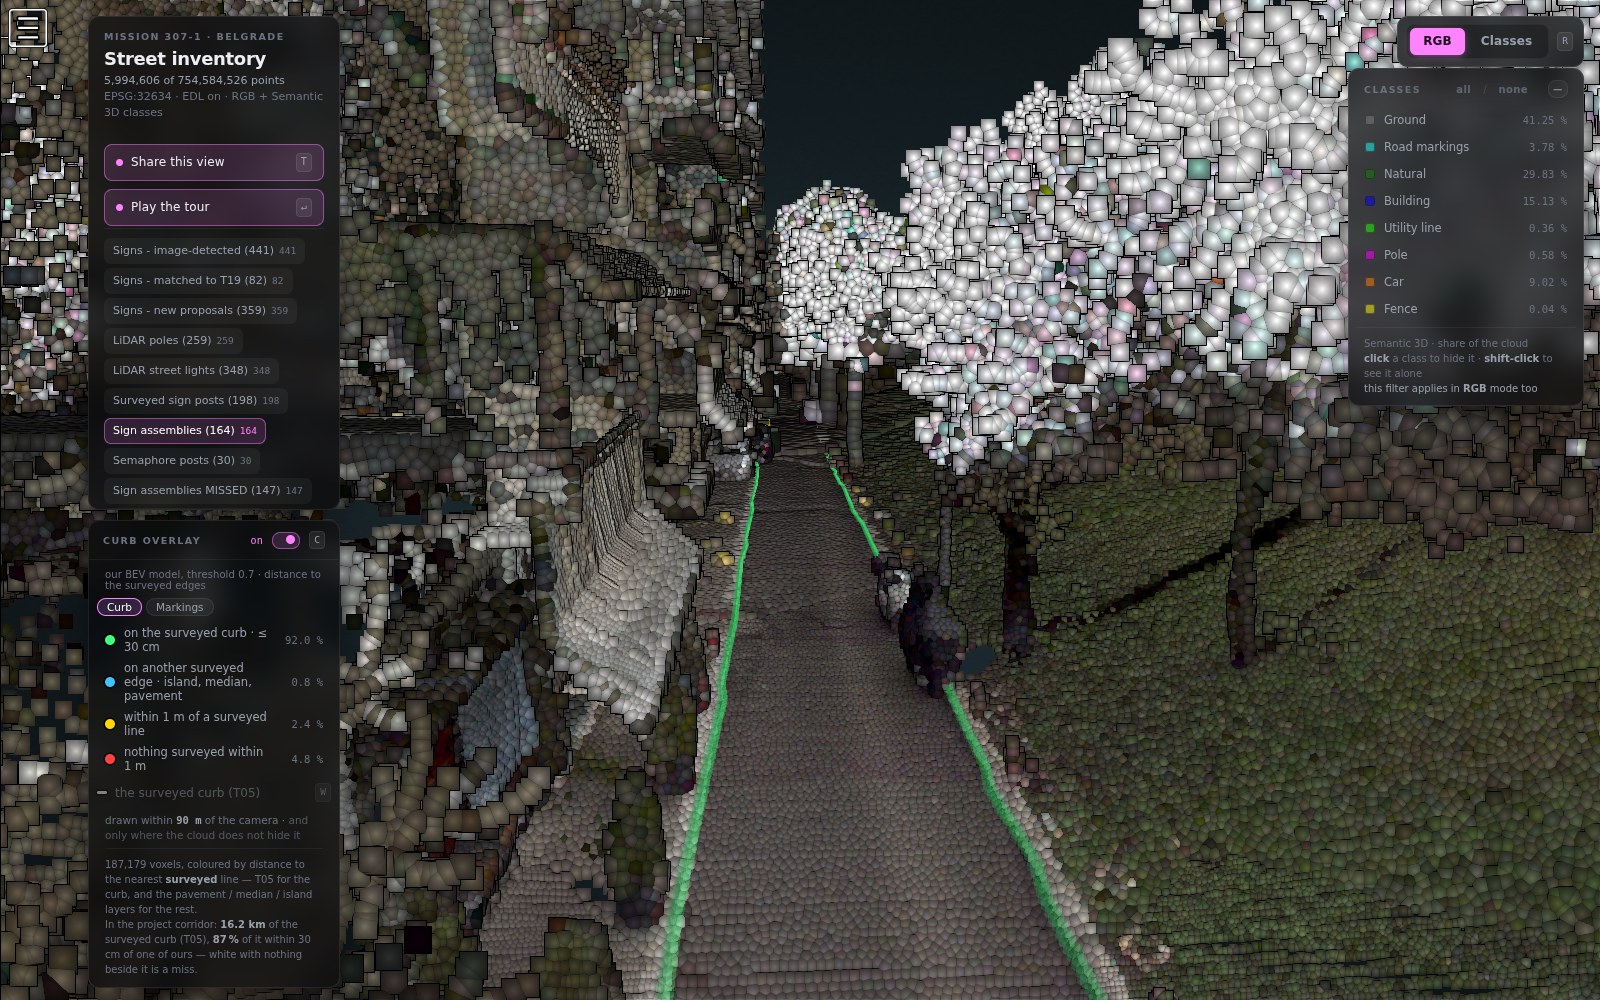
307-1 · curb head · threshold 0.70 · median planimetric deviation 4.2 cm · green = within 30 cm of the surveyed kerb
03  /  THE KERBTEN MISSIONS · 217 KM

Take the surveyed line away and the measurement is still there.

The white line is the register. Switch it off and what remains is what the model found by itself. Across ten missions, scored only on the stripes no training ever saw, the kerb lands between 0.81 and 0.94.

scored onF1 @ 30 cm
held-out stripes, 10 missions0.809 – 0.942
median of those0.863
311-3, a mission never trained on0.793
307-1, a different sensor entirely0.888

217.4 km of surveyed kerb inside the scanned corridor · 201.8 km predicted · 38.9 km of it on stripes held out from training

04  /  THE PAINTT22 – T26

Zebras, arrows, give-way triangles — the same pass, no extra drive.

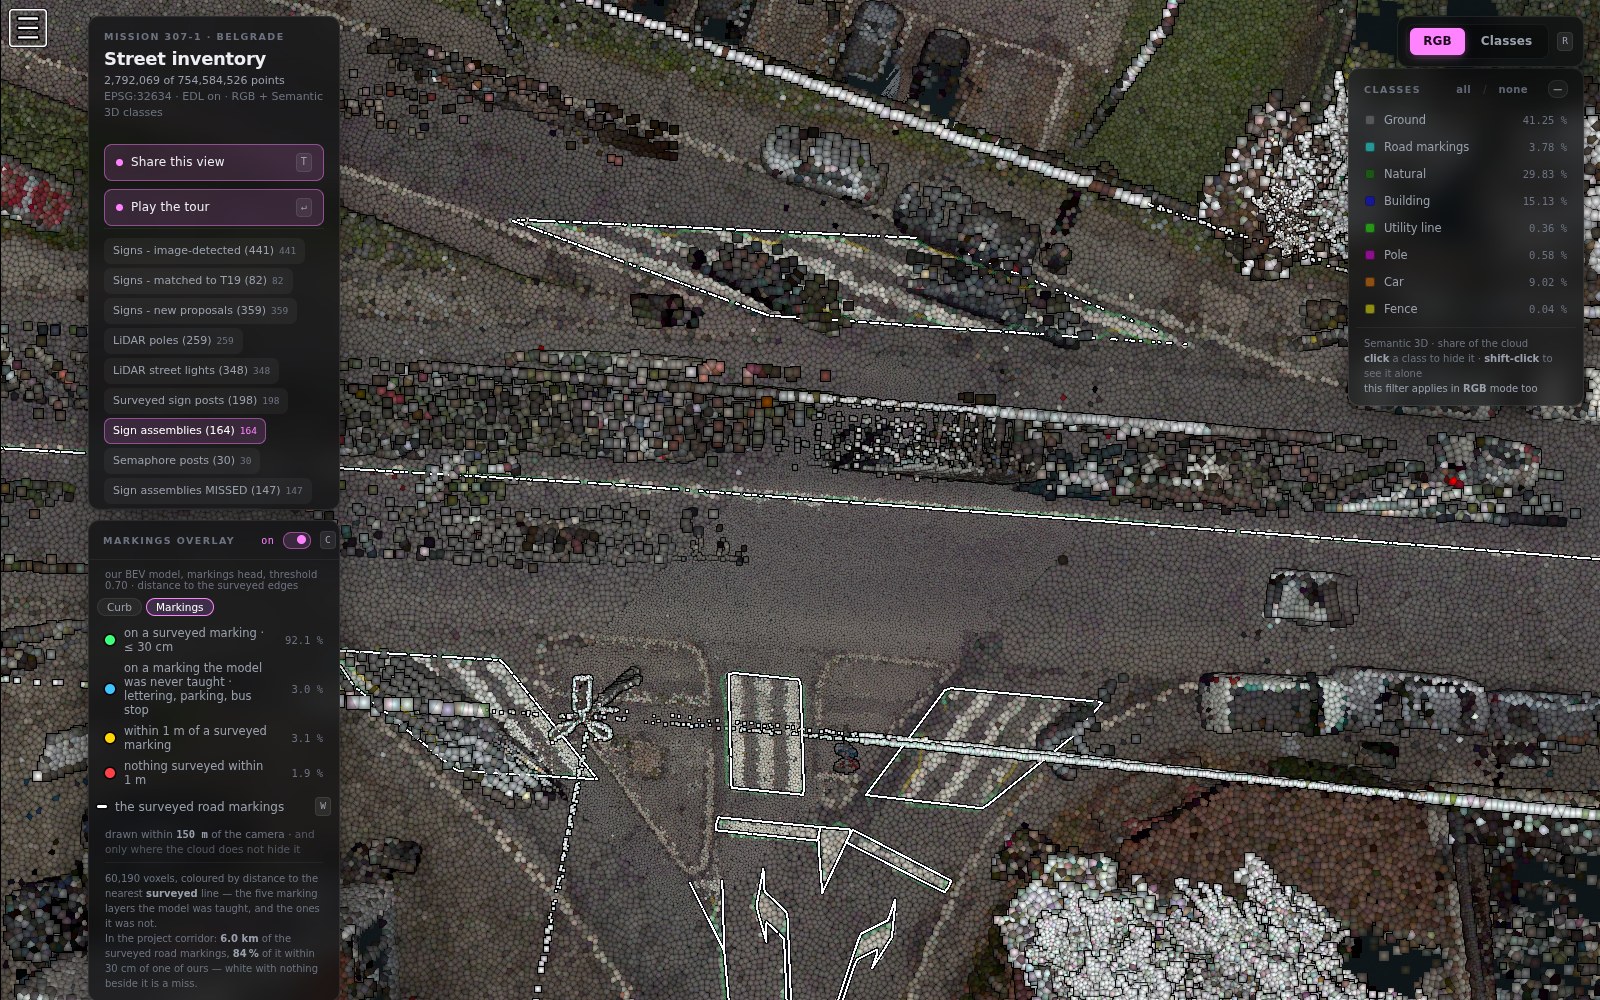
Road markings come out of the same model. The weak layers are the ones that were never in its training label, which is a thing to fix rather than a limit of the method.

layertaughtrecall @ 30 cm
longitudinal lines · T22yes0.919
pedestrian crossings · T23yes0.756
guidance fields · T25yes0.886
arrows · T24yes0.552
lettering “BUS” · T27no0.085
parking bays · T33no0.042

307-1 · markings head · F1 @ 30 cm 0.877, median deviation 5.3 cm · 92.1 % on a surveyed marking

05  /  THE SIGN164 ASSEMBLIES

Every sign is photographed from the side that sees its face.

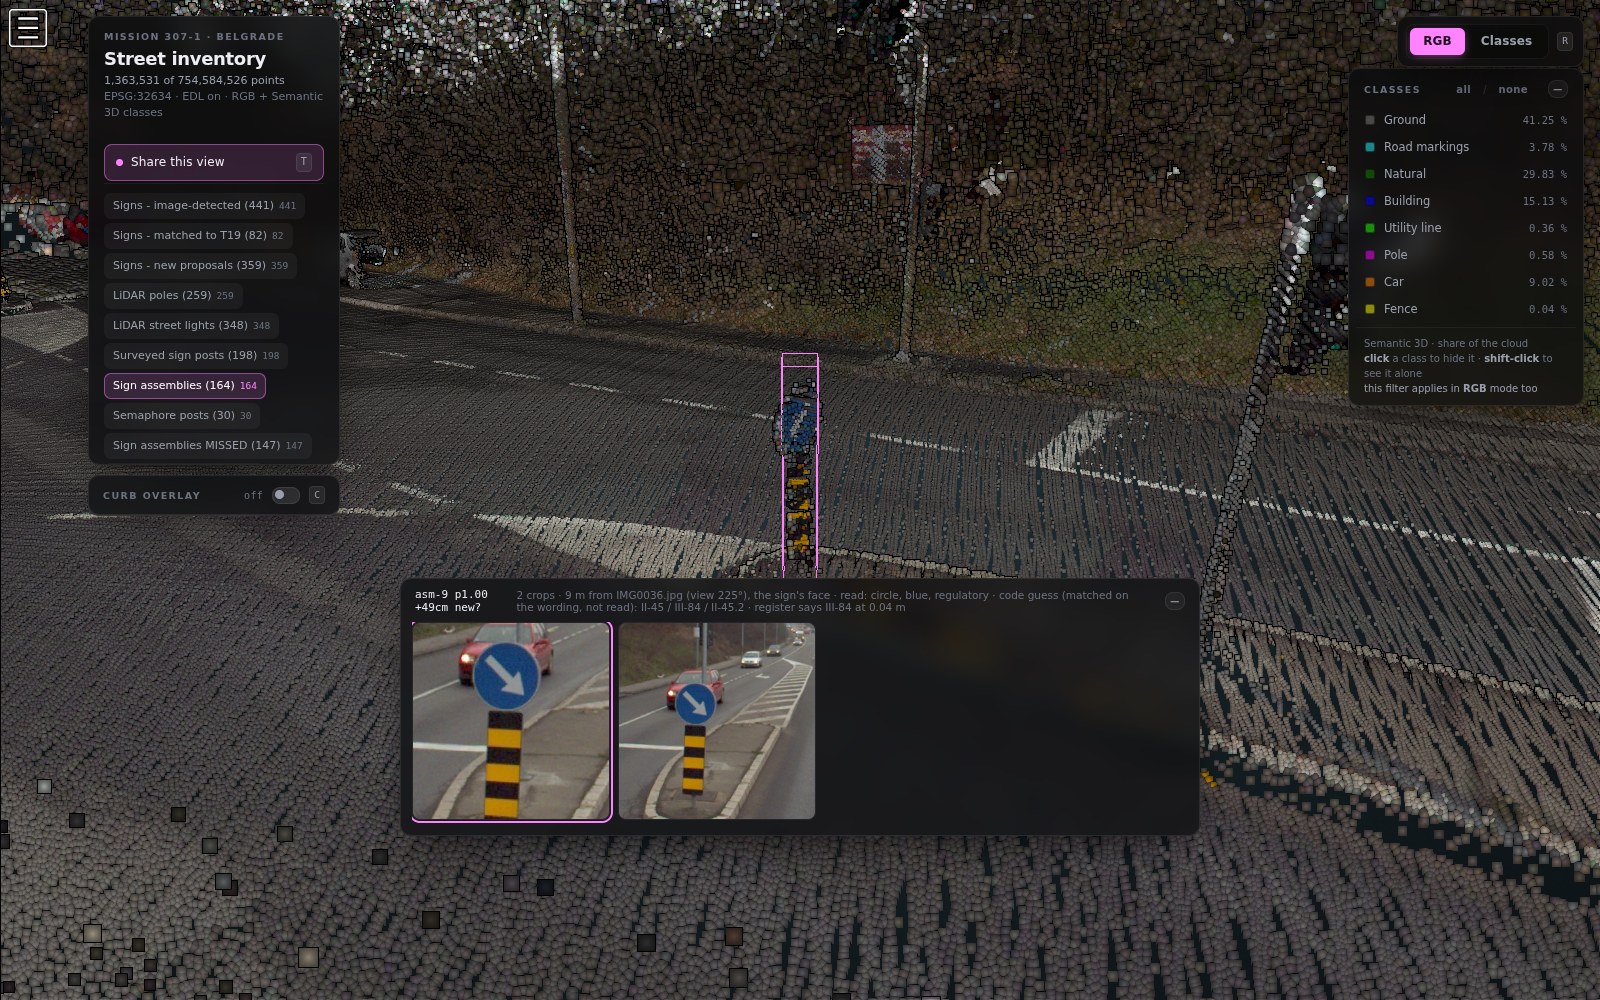
The camera is not the nearest one. It is chosen from the image segmentation, which separates the front of a sign from its back, so the crop shows the face and not the pole. A vision model then reads the sign, and the register's own record is printed beside the reading.

measured on 211 assemblies
photographed164 / 164
from the sign's face97 %
reading agrees with the register0.839 – 0.945
catalogue code, in the top three0.863

shape, colour and group against T19 · 0.839 against the nearest plate, 0.945 against any plate on the same post — a quarter of these posts carry several

06  /  BELOW THE SURFACET66 · T65

Manholes and gullies, found in the photographs and placed on the cloud.

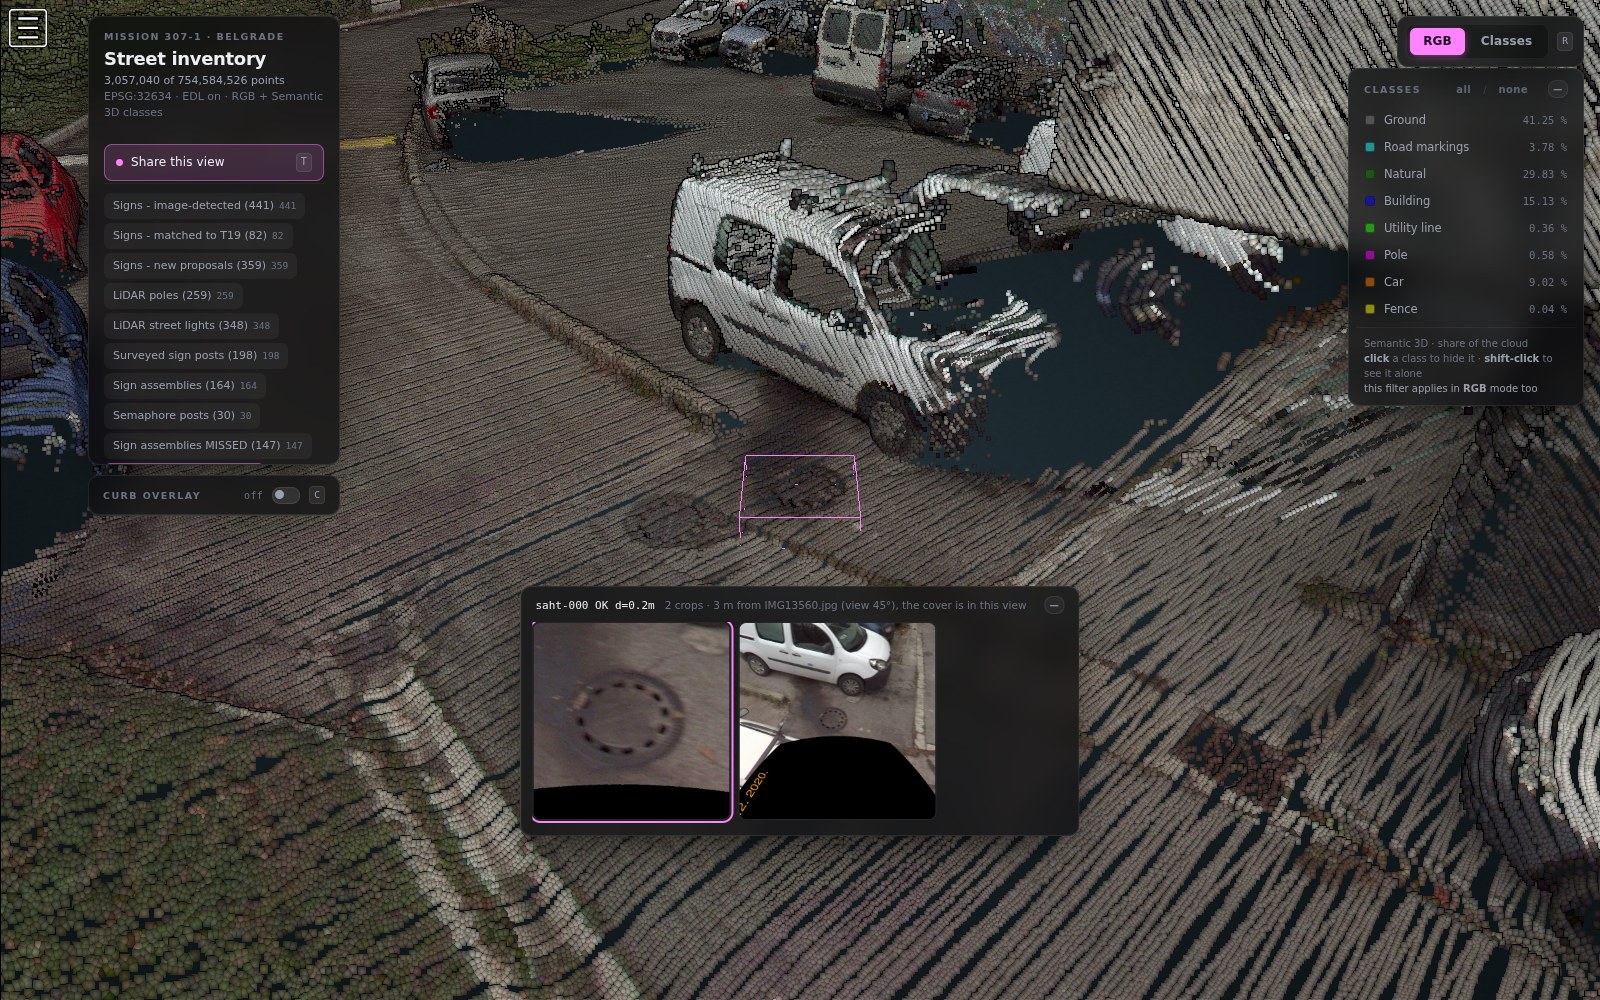
Each laser point takes the class of the nearest camera pixel that can actually see it — tested with a depth buffer, so a point behind a parked van does not inherit the van. The manhole and gully points are then clustered into objects and matched to the register.

307-1cameras reachedrecall
manholes · T6622333.6 %
gullies · T659948.5 %
street lights · T60396P 0.713 / R 0.598

recall is counted over the records the cameras reached, not the ones the laser reached — a cover no camera ever labelled cannot be found this way

07  /  THE WORK ORDER41 CROSSINGS

Which crossings to repaint first, ranked by how little paint is left.

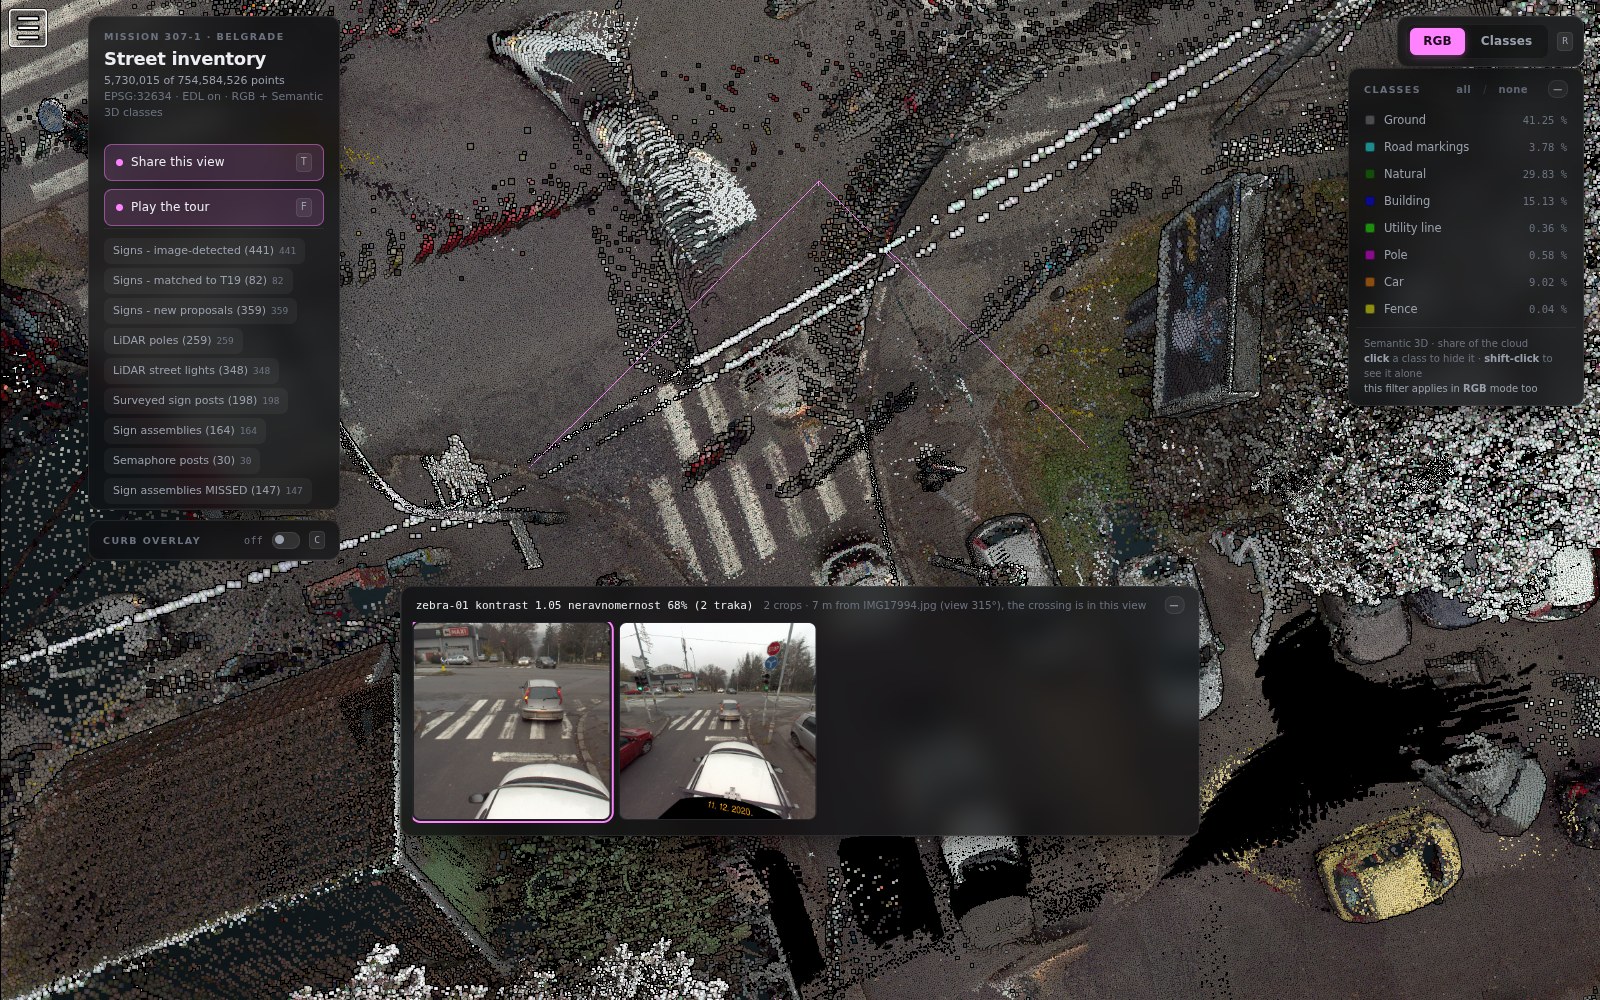
Paint is retroreflective and worn paint is not, so the laser's own intensity measures it. Every surveyed crossing is compared with a ring of the asphalt around it, with anything overhung by more than half a metre excluded so a tree is not read as wear. The output is the order a crew would drive.

contrast = paint / asphalt
worst crossing on 307-11.05
best crossing on 307-17.79
crossings ranked41

1.00 means the paint is no brighter than the road

this is not a detection — the crossings are the register's own. What is new is the condition, and the order

08  /  WHERE WE ARE WRONG4.8 % OF OUR LINE

Red is the interesting colour.

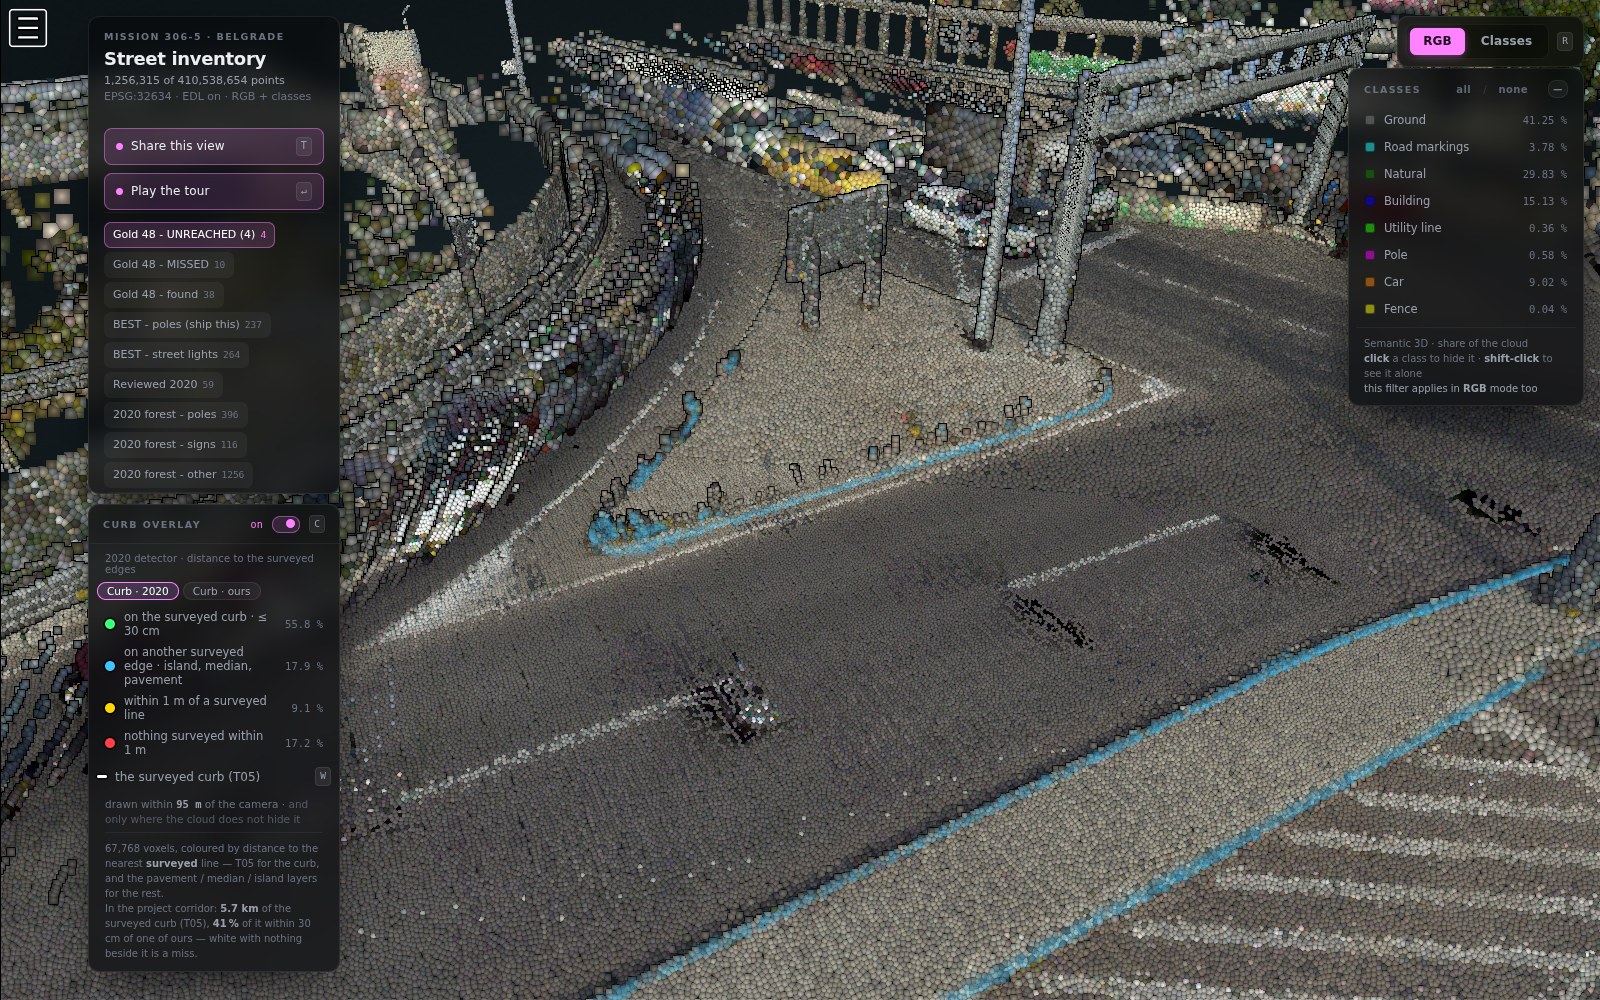
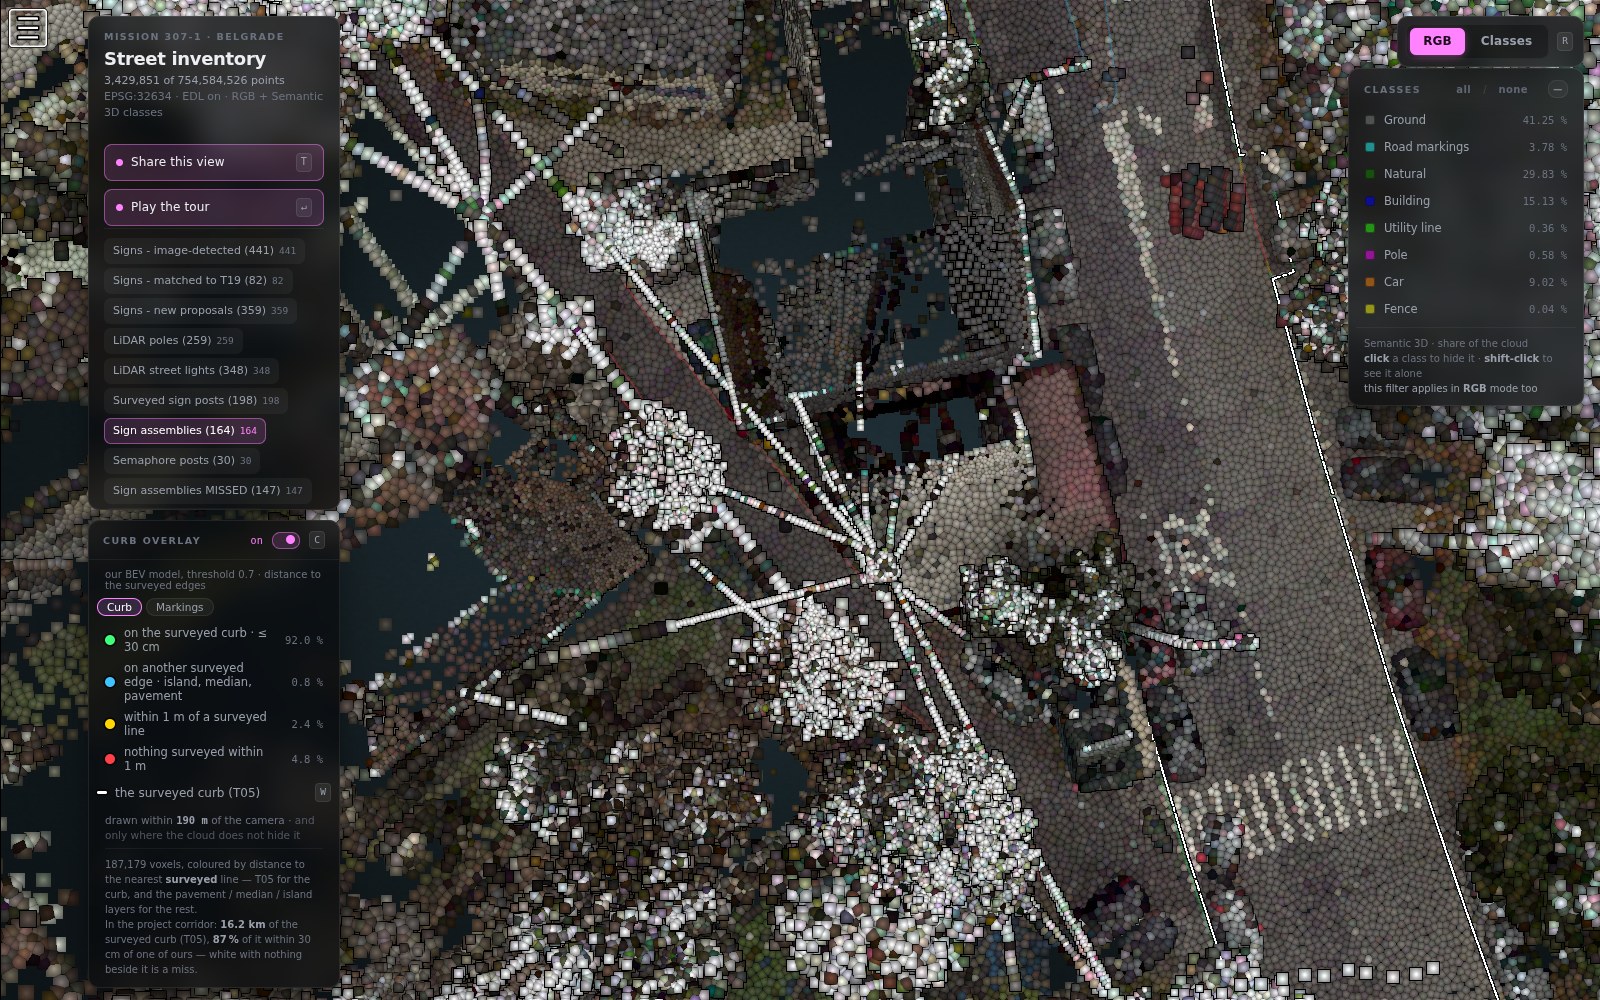
Some of it is the register and some of it is us. A pedestrian island is a real kerb recorded in a different layer, so it is blue, not red — getting that wrong once cost us a third of the red band. Some of what is left is ours to answer for: on 307-1 the largest red run follows a building's roof edge, where the model keyed on a linear step in height and called it a kerb. And some of it is not ours at all — that is the next slide.

307-1 · 187,179 voxels
on the surveyed kerb92.0 %
on another surveyed edge0.8 %
within a metre of one2.4 %
nothing surveyed within a metre4.8 %

left — 306-5, a pedestrian island: surveyed, in another layer   /   right — 307-1, our own false positive   /   a second island, 1.2 km away

09  /  THE OTHER DIRECTIONFOUND, NOT RECORDED

The rest of it is standing there, with no line underneath.

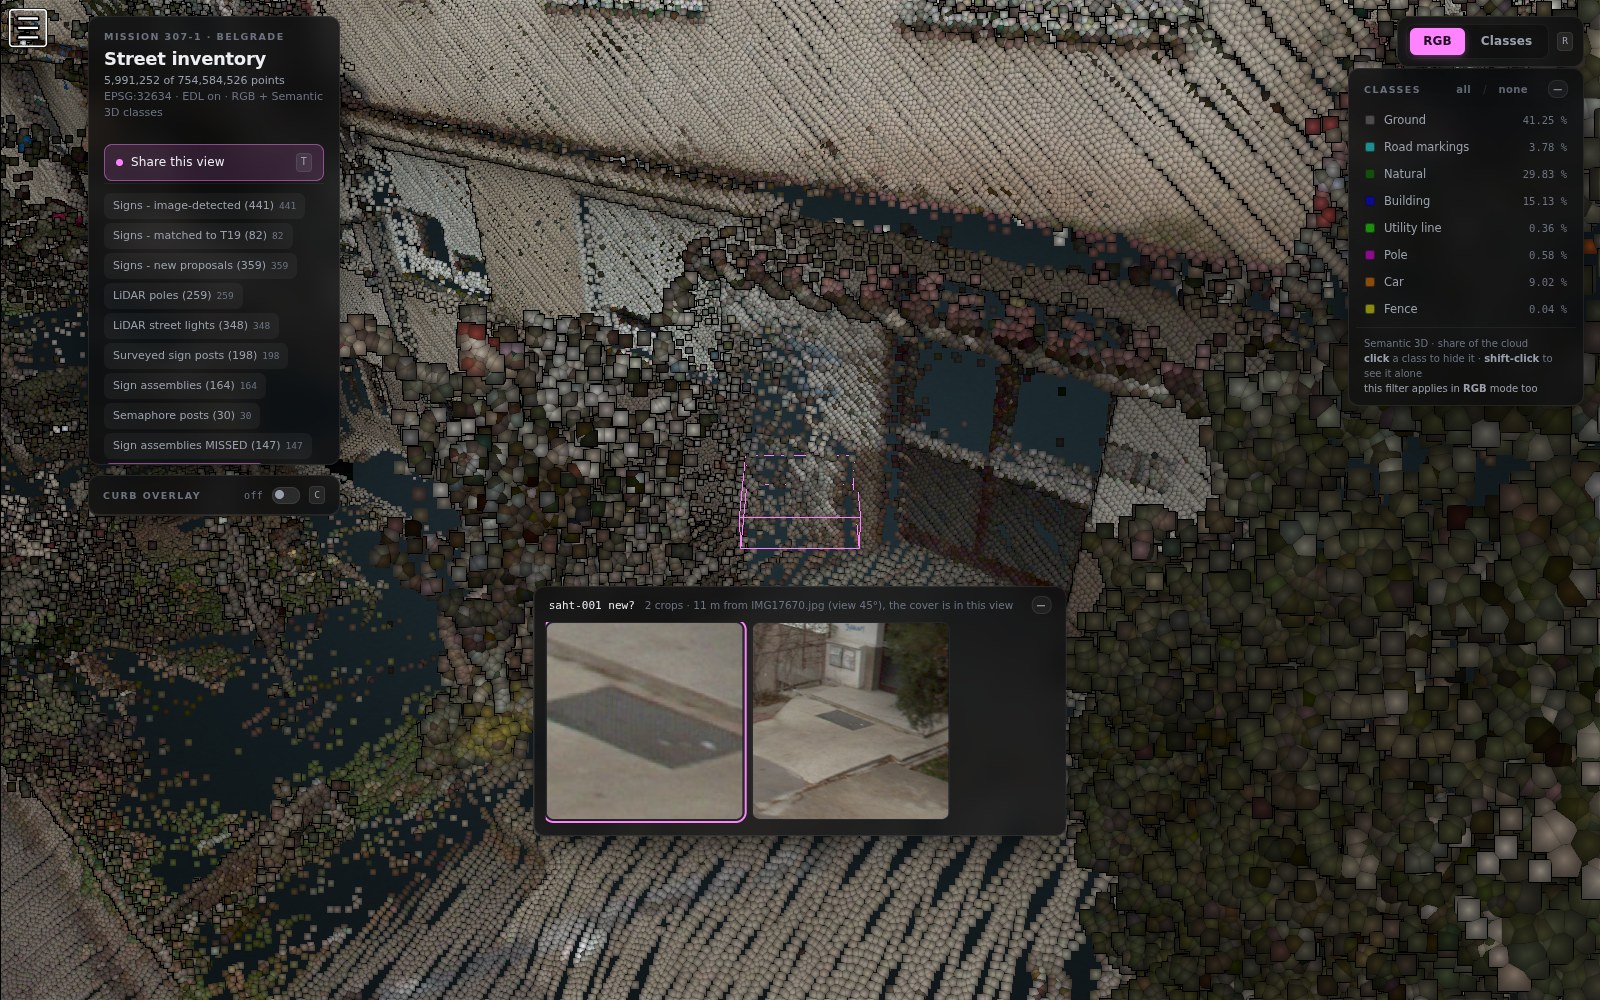
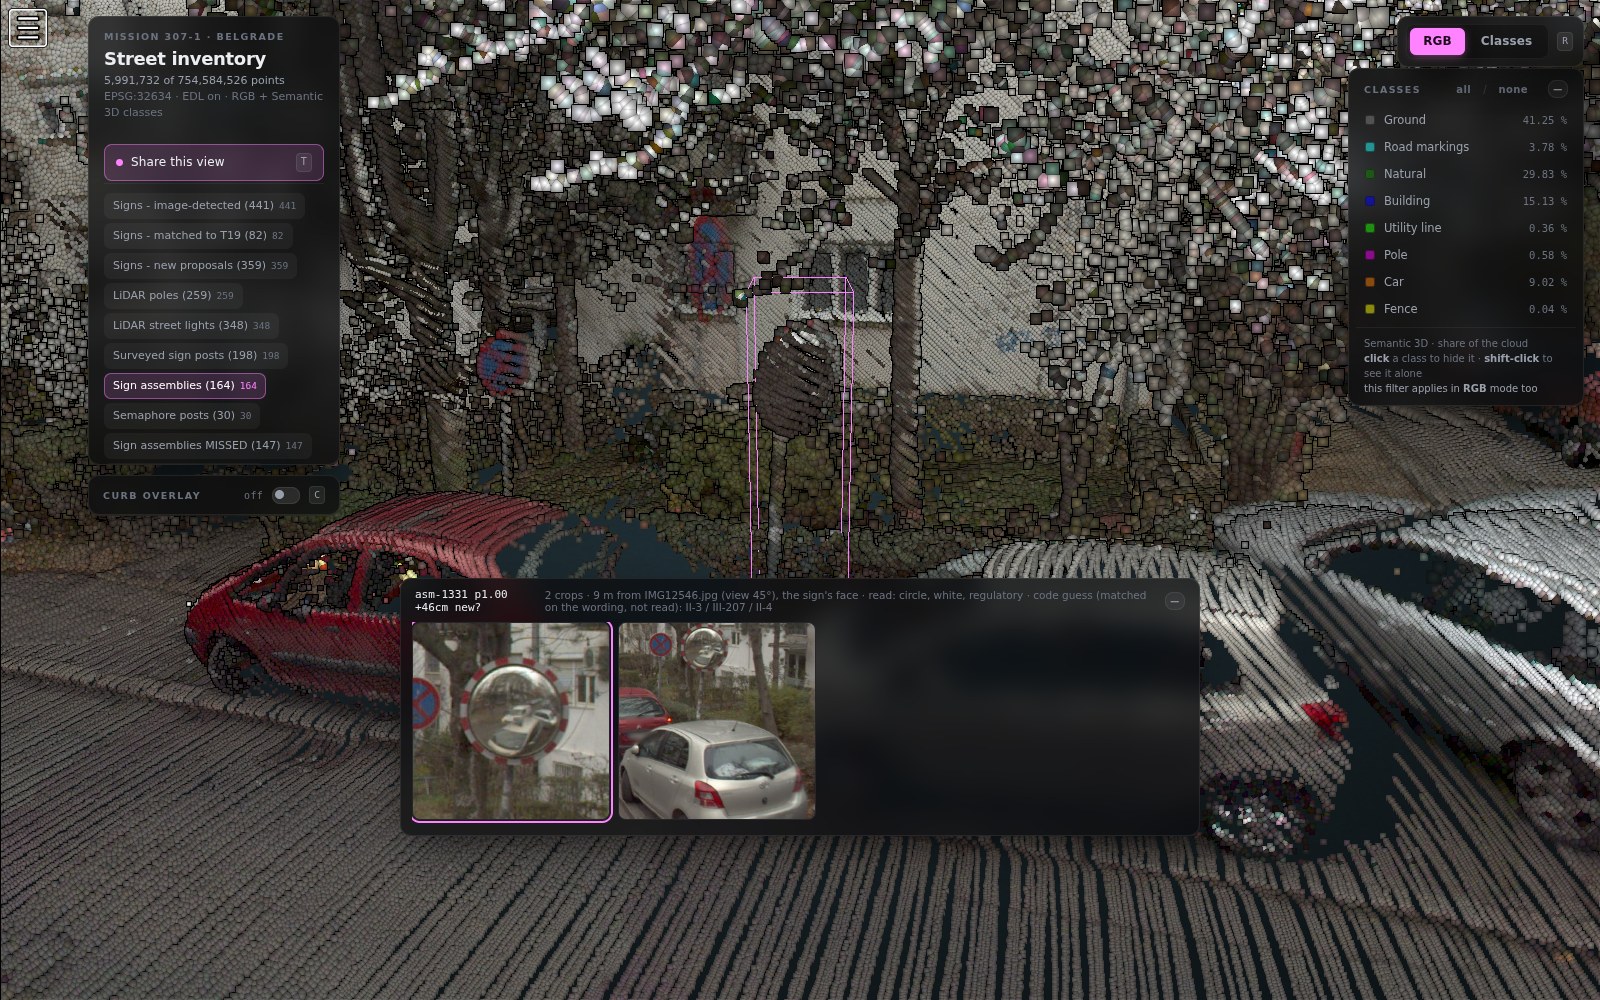
Red means “nothing surveyed within a metre”. It is not a synonym for a mistake. In each of these three the object is plainly there — in the cloud, or in the crop, or both — and absent from the layer that should hold it. Scored against the register they count against us. On the street they are the reason to do this at all.

what the pass foundwhat the register holds there
a kerbed island inside a junction no line of any kind within 6.9 m
50 of our 126 manhole covers no T66 record within a metre
a convex traffic mirror on a surveyed post the post, yes — the mirror, nowhere

left — 455 of our candidate points sit on that island; the three island layers T08, T09, T11 have nothing within 80 m  /  middle — 31 of those 50 covers have no record within five metres  /  right — the sign standard is surveyed 0.38 m away and the mirror layer T43 is empty for 60 m. Our reader called it a white circular sign; the crop corrects that in one look, which is what review is for

10  /  TWO WITNESSESLASER AND CAMERA

The geometry proposes. The photograph is allowed to overrule it.

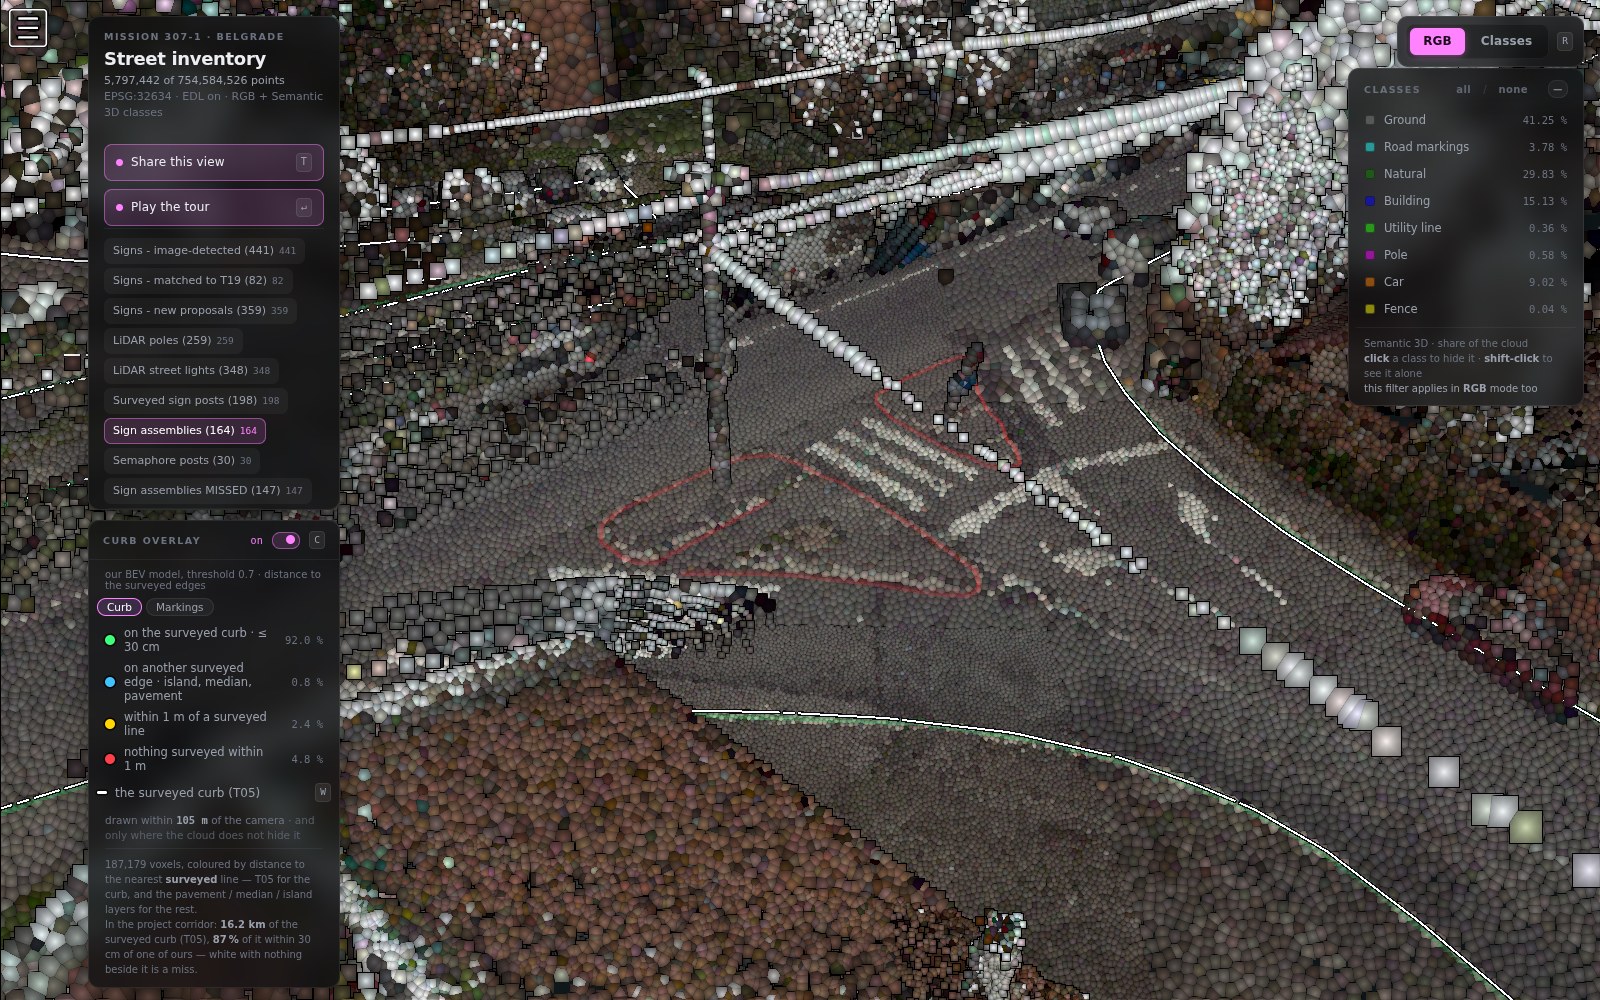
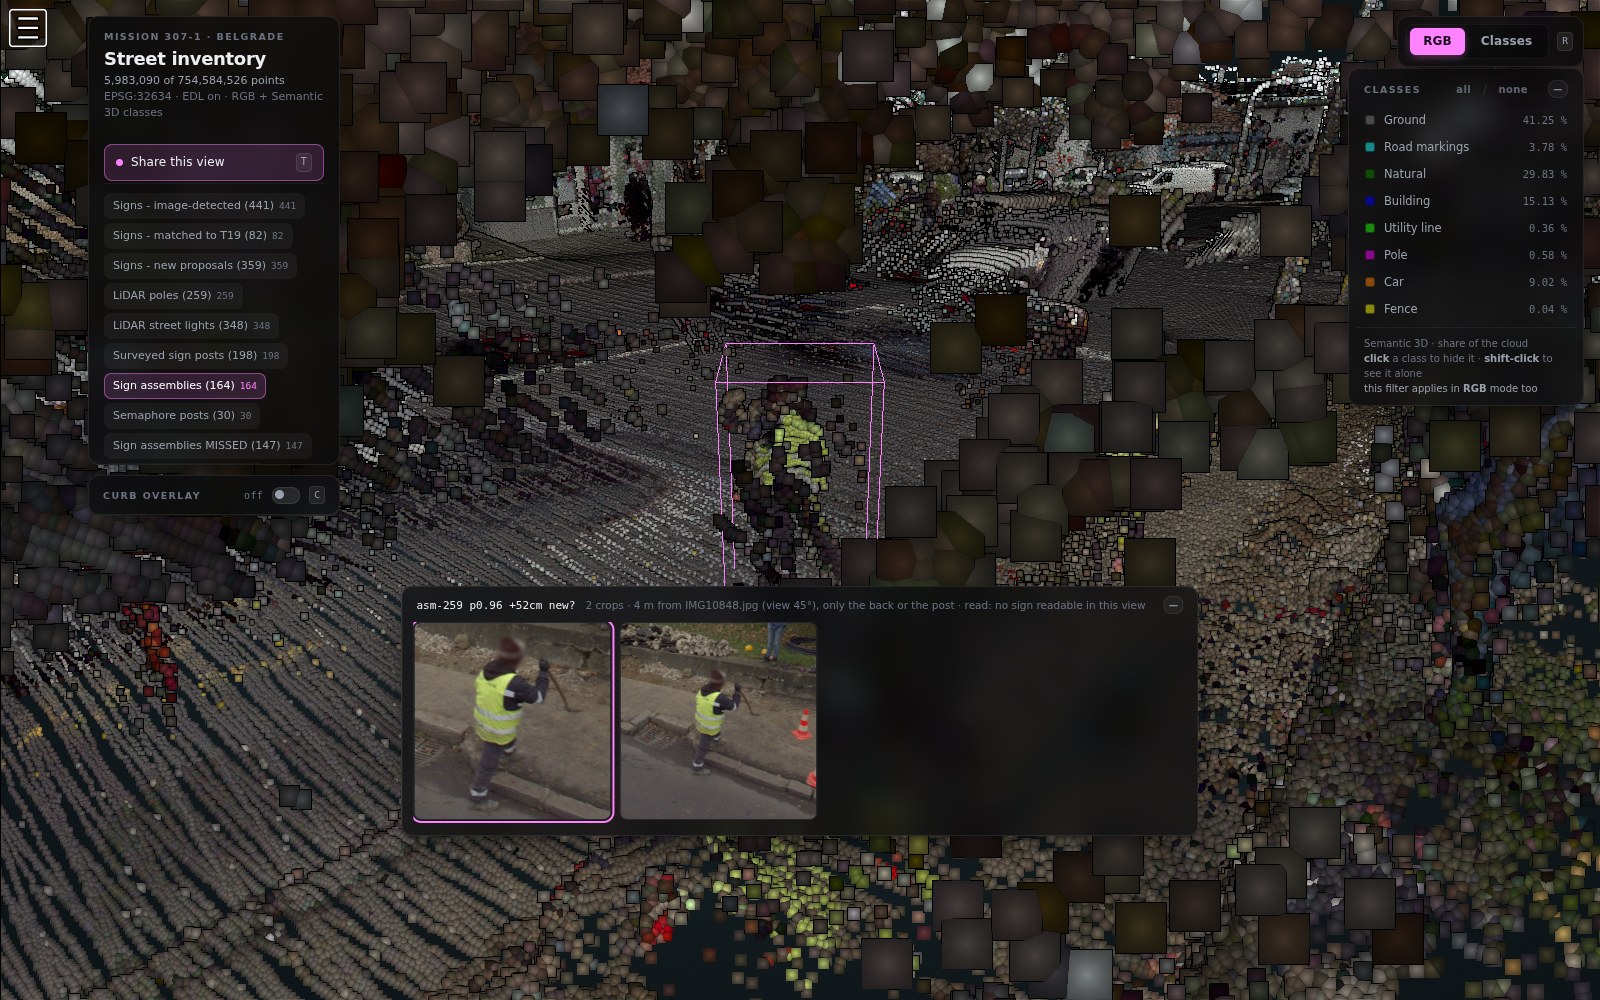
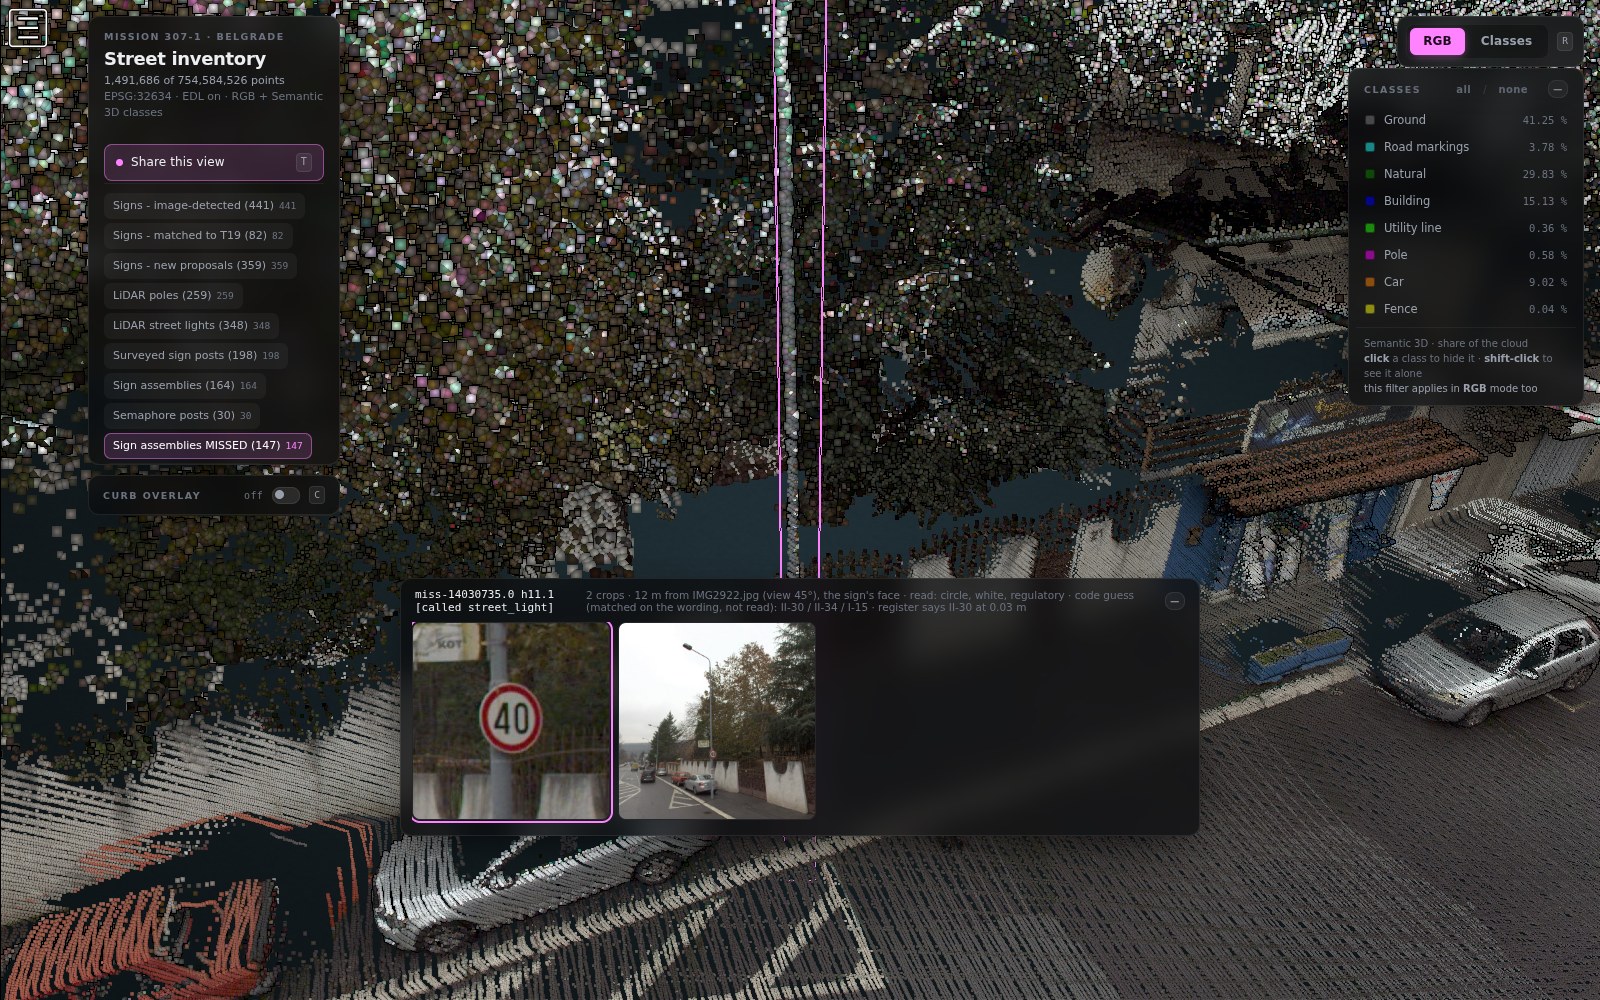
A standing person is a narrow vertical column of points, and a high-visibility vest is made of the same retroreflective material as a sign face — so both of the laser's cues said “sign” here, at probability 0.955. The image segmentation found no sign pixels, the vision model read nothing, and they were right. The same pairing works in the other direction: where the register has a sign and we proposed none, the photograph is in the panel, so the miss can be confirmed in a second rather than driven to.

307-1 · sign assemblies
proposed from the laser164
both image stages disagree3
… and the image was right3 of 3
surveyed, not proposed147
… with a photograph to check82
… never driven past at all65

left — our false positive, caught by the camera   /   right — our miss: this post stands under a tree and we called it a street light. The photograph settles it in a second, and the reading is right — circle, white, regulatory, shortlist led by II-30, which is what the register has, 3 cm away

11  /  DENSITYWHY FROM THE ROAD

A kerb is twelve centimetres tall. You cannot see it from an aeroplane.

National airborne surveys are specified at four to eight points per square metre — enough for terrain, buildings and canopy. A kerb edge, a sign's face and a manhole's rim live two orders of magnitude below that.

4–8
points per m², national airborne LiDAR specification
3,294
points per m², this survey, where the scan reached
~2 h
machine time per mission, unattended, from raw cloud to reviewed inventory
airborne figure: Croatian State Geodetic Administration, LiDAR product specification · survey figure measured on 307-1
12  /  WHAT IT FEEDSTHE DECISION LAYER

Safety models are hungry for exactly these attributes. Today they are typed in by hand.

A safety performance function needs the road's geometry; a crash modification factor needs to know what is already installed. That is why most of them run on traffic volume and segment length and nothing else — the attributes were too expensive to collect. They are not any more.

what a safety model asks forwhere it comes from now
lane count and widthmarkings T22 & kerb T05
median and edge treatmentedge head · T06, T07, T09, T10
is there a pedestrian crossingcrossings T23
is it signed, and with whatassemblies read against T19
is the crossing litstreet lights vs T60
is the paint still therecrossing wear, ranked
the inventory is not the product — it is the input to the decision that follows it
13  /  WHAT IS NOT CLAIMEDAPPENDIX

The boundary of every number on these slides.

claimboundary
kerb, markings, edges scored against the register inside the scanned corridor only. Eight of the ten missions are in the model's training set; the quoted band is their held-out stripes.
sign reading shape, colour and group only. The catalogue code is a nearest-neighbour lookup, right first time 58 % — shown as a shortlist, never as an identification.
manholes and gullies recall over the records the cameras reached. Object heads for poles, trees and bollards are untuned and no number is quoted for them.
crossing wear a relative intensity measure, not a certified retroreflectivity reading. No field calibration has been done.
not claimed at all no causal reduction in crashes, no independent audit, no accuracy for anything the register does not record.
full record: inventory/00_doc/00_DECISIONS.md